Real time dashboards for your personal weather station

Build a clean, always on weather display you can run on phones, tablets, desktops, and wall screens. Drag and drop layouts, charts, rules, and virtual sensors. Works with Davis, Ecowitt, Ambient, Netatmo, Meteobridge, WeatherDisplay Software, and more.
Weather Dashboard
Trusted by 100's of members in over 20 countries
How it works
Three quick steps to get your dashboard live.
1
Connect your station
2
Pick a template
3
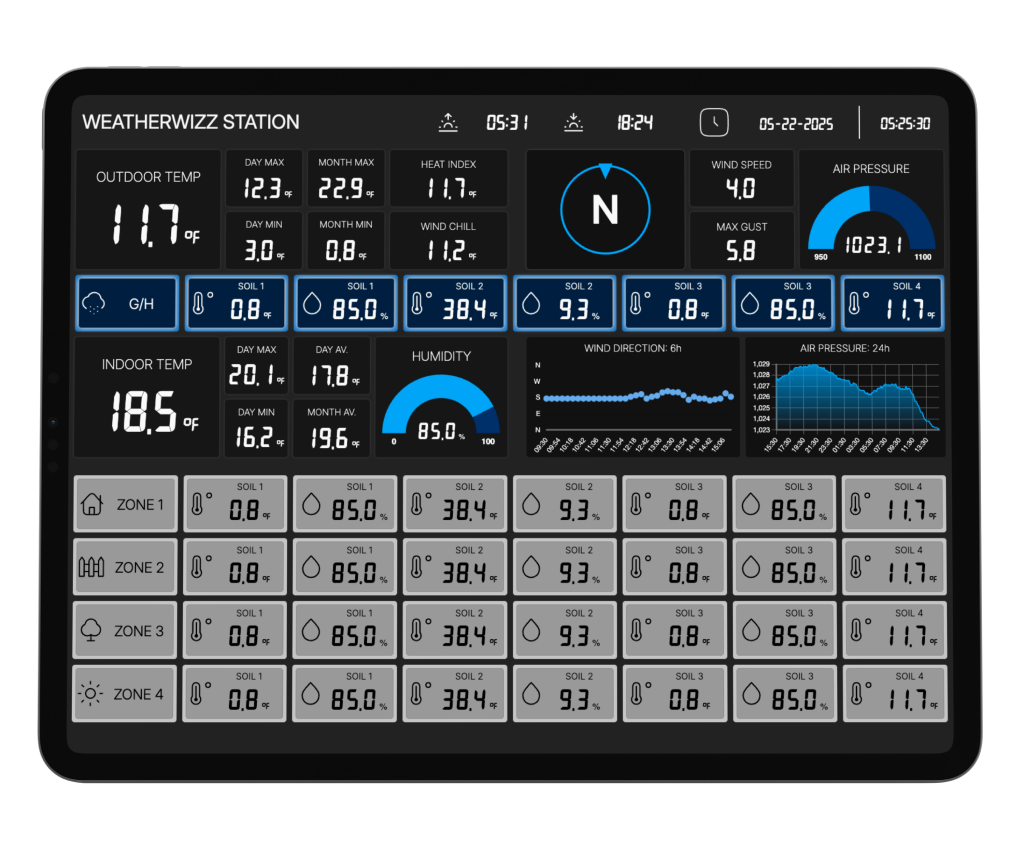
Set your sensors and view
Works with...
Or any weather station connected to the Internet using:
Why WeatherWizz dashboards are easy to build
Go from scattered station data to a clean, always‑ready display with outcomes you can see right away:
  • Drag-and-drop layouts, charts, rules, and virtual sensors
  • Prebuilt templates and layouts to help you get started and customise with ease
  • Intuitive, easy-to-use dashboard builder
  • No web development skills required
  • Create dashboards optimised for desktop, tablet, and mobile
  • Build different dashboards for different purposes
  • Create simple rules to highlight sensor values with visual effects
  • Compatible with Davis (via WeatherLink or Meteobridge), Ecowitt, Ambient, Netatmo, Meteobridge, WeatherDisplay Software, and more
Drag-and-drop demo dashboard
Drag tiles to reorder.
Rain rate ⋮⋮
12.4 mm/h
Wind gauge ⋮⋮
18 km/h
Humidity ⋮⋮
62%
Combine Data from Multiple Weather Stations
Link multiple weather stations to one weather dashboard with WeatherWizz. Compare sensor data and monitor different spots at once, perfect for efficiency. Mix brands like Ecowitt and Davis WeatherLink, picking the best gear for you without compatibility hassles. Build your ideal setup!
Rule Builder
Turn your weather dashboard into a smart, responsive system with Rule Builder. It’s super easy to set up and gives you powerful control over how your weather station sensors are displayed and animated. Automatically highlight extreme conditions, trigger visual alerts, and focus attention where it matters most!
Create Your Own Weather Stats
Turn your weather data into personalised insights. With Virtual Sensors, you can create custom stats like “Hottest Day This Month” or “Cold Mornings Below 5°C”. No technical knowledge needed. Just choose what you want to measure, test it, and it’s ready to use in your weather dashboard.
Data Reports
Access your daily, monthly, and yearly data with ease. Edit past readings and download full reports in seconds. Whether you're checking trends or adjusting for calibrations, this tool saves time and makes data management simple.
Get full access for only $8.95 per month
Starting with a 14-day free trial
Personal weather dashboard
Rapid 5 second real-time updates **
Up to 200 sensors per dashboard
Up to 100 weather dashboards
Personal subdomain name
Build your own reports
Edit data
Works with many stations / devices
No third party adverts
Installable apps for all modern browsers and devices
** Updates approximately every 5 seconds if permitted by your station, device, or software.